Methods
1. Gather Data
- Obtain channel geometry and cross sections.
- Determine peak flows.
2. Run a Hydraulic Analysis
- Set up and run HEC-RAS model.
- Design channel crossing.
Gathering Data
Geometry and Channel Cross Sections
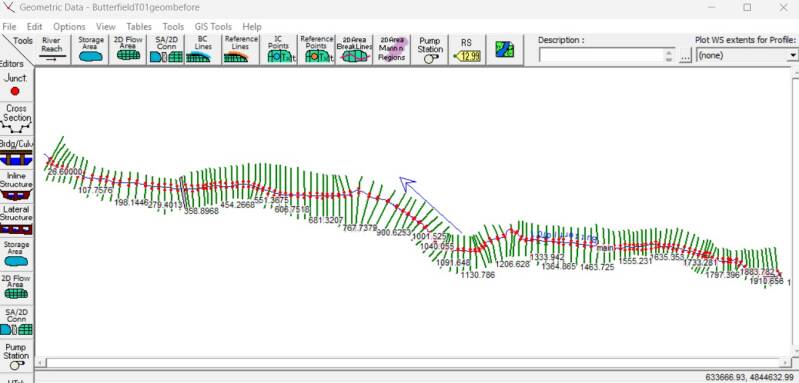
Geometry and channel cross sections were taken from the MNDNR FEMA hydraulic model database. In 2012 channel cross sections were taken and a hydraulic model was created for the watershed.
The model maps 1996 meters of channel and contains 133 cross sections.
Peak Flows
The watershed is a headwater and has no stream gages or flow data history. The SCS runoff equation was used to determine peak flows at the outfall of the watershed.
Runoff Equation
The watershed is a headwater and has no stream gages or flow data history. The SCS runoff equation was used to determine peak flows at the outfall of the watershed.

SCS runoff equation used to calculate peak flows.
Design Storm
NOAA Atlas 14 was used to determine a design storm and resulting amount of precipitation on the watershed. The 100 year, 24 hour storm was 7.79 inches. 7.79 inches multiplied by the area of the watershed will be the total volume of water as the watershed has no inflows.
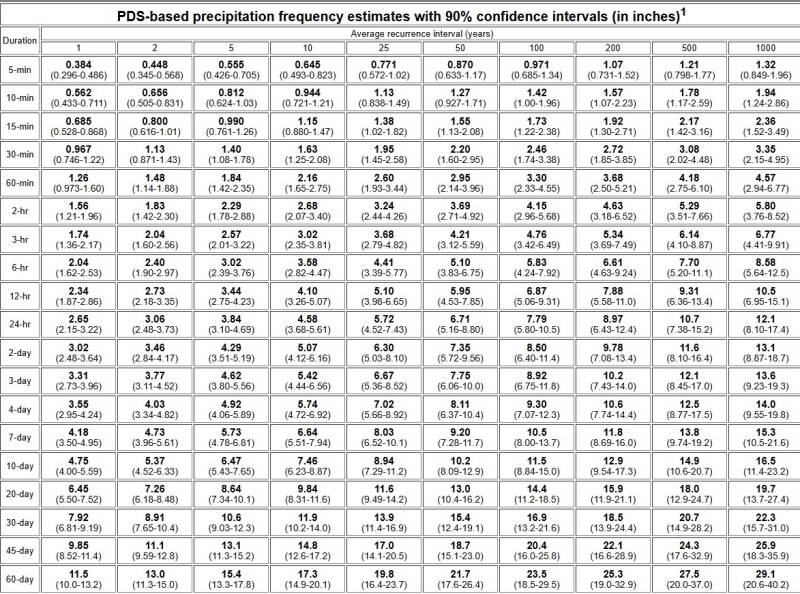
NOAA Atlas 14 precipitation values for Hokah, MN.
Area
Minnesota Natural Resource Atlas was used to determine the total watershed area and percentage of cropland and forest.
Total area: 787 acres
Cropland: 295 acres
Forest: 492 acres

Crop land in Butterfield Valley watershed.
Curve Number (CN)
I used NRCS soil data to determine that the hydraulic soil group is B.
CN row crops: 81
CN forest: 66
Composite CN: 71
The composite CN was further adjusted based on existing moisture content condition three which corresponds to saturated soil.
Final CN: 86
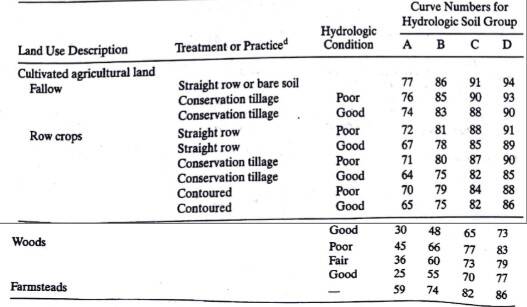
Curve Numbers for various land uses and soil groups.
Overland Flow
Using the SCS equation and the determined data the amount of overland flow was 6.13 inches.
Time of Concentration
The Kirpich analytical equation for small, steep, rural basins was used. The Minnesota Resource Atlas was used to determine the longest travel path for water in the watershed and the corresponding average slope.
Length: 12,114 ft
Slope: 0.0429 ft/ft
Time of Concentration: 36.5 minutes


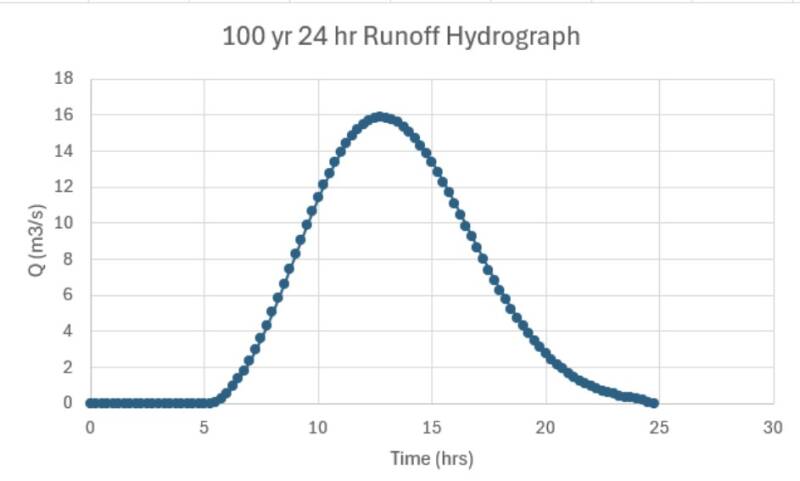
Flow Hydrograph
Using the total runoff, time of concentration, and watershed area I used Chat GPT to create a hydrograph of the rain event.
Peak flow: 15.5 m3/s
Hydraulic Analysis
Steady Flow Analysis
The peak flow was using as the flow and the downstream boundary condition was critical depth. In reality peak flow will only occur for a short period of time but I used peak flow for the model to show the largest extents of flooding.

Water surface profile for peak flow.
Crossing Location
The best place to locate a crossing is at station 13+64 of the hydraulic model. This is where an existing road crosses the creek.


Location of crossing
Location of crossing
Culvert Design
Culvert was designed using HEC RAS
- Two 2 meter diameter barrels
- Corrugated metal pipe
- Mitered entrance
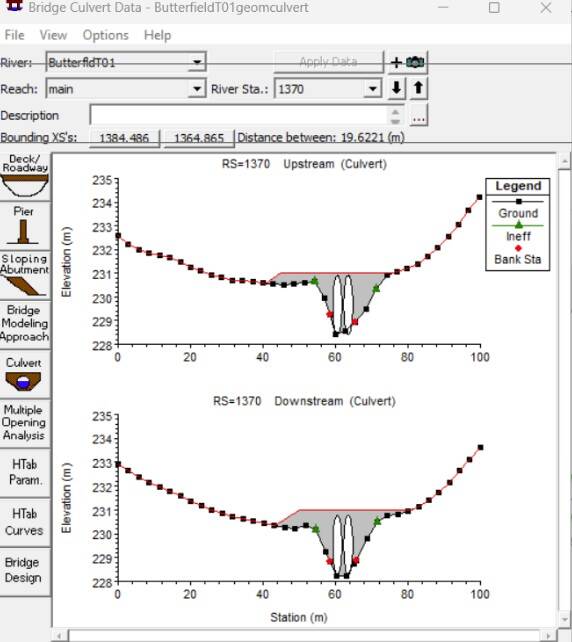
Culvert design in HEC RAS
Create Your Own Website With Webador